Niche Theory and the Human Gut Microbiome

Without really having the time to write a full blog post, I want to mention two recent papers that have strongly influenced my understanding of the microbiome.

Niche Theory

The ecological concept of the “niche” is something that is discussed quite often in the field of the microbiome, namely that each bacterial species occupies a niche, and any incoming organism trying to use that same niche will be blocked from establishing itself. The mechanisms and physical factors that cause this “niche exclusion” is probably much more clearly described in the ecological study of plants and animals — in the case of the microbiome I have often wondered just what utility or value this concept really had.

That all changed a few weeks ago with a pair of papers from the Elinav group.

The Papers

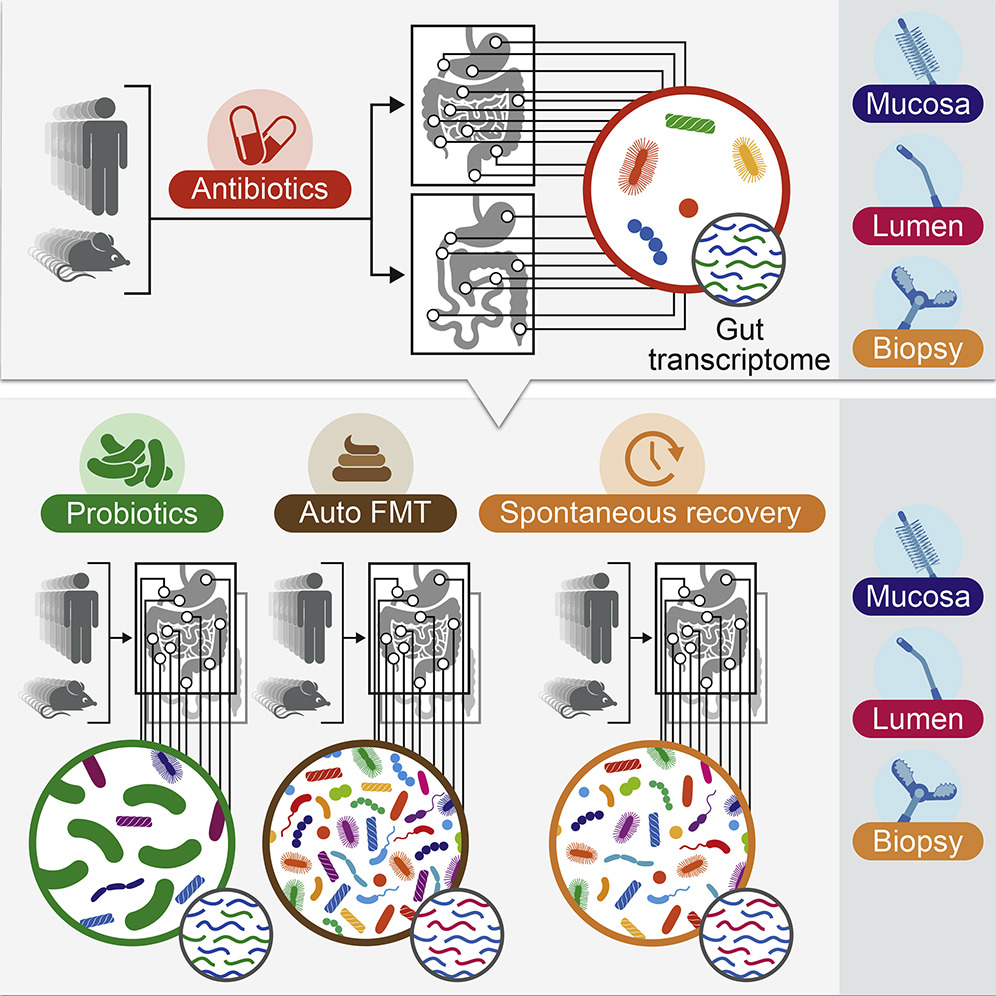
Personalized Gut Mucosal Colonization Resistance to Empiric Probiotics Is Associated with Unique Host and Microbiome Features

1-s2.0-S0092867418311024-fx1_lrg.jpg
1-s2.0-S0092867418311085-fx1_lrg.jpg

Quick, Quick Summary

At the risk of oversimplifying, I’ll try to summarize the two biggest points I took home from these papers.

  1. Lowering the abundance and diversity of bacteria in the gut can increase the probability that a new strain of bacteria (from a probiotic) is able to grow and establish itself

  2. The ability of a new bacteria (from a probiotic) to grow and persist in the gut varies widely on a person-by-person basis

Basically, the authors showed quite convincingly that the “niche exclusion” effect does indeed happen in the microbiome, and that the degree of niche exclusion is highly dependent on what microbes are present, as well as a host of other unknown factors.

So many more questions

Like any good study, this raises more questions than it answers. What genetic factors determine whether a new strain of bacteria can grow in the gut? Is it even possible to design a probiotic that can grow in the gut of any human? Are the rules for “niche exclusion” consistent across bacterial species or varied?

As an aside, these studies demonstrate the consistent observation that probiotics generally don’t stick around after you take them. If you have to take a probiotic every day in order to sustain its effect, it’s not a real probiotic.

I invite you to read over these papers and take what you can from them. If I manage to put together a more lengthy or interesting summary, I’ll make sure to post it at some point.

Microbiome Research: Hope over Hype

The story of microbiome research is one of hope and hype, both elevated to an extreme and fraught with controversy. You need look no further than popular blogs and high profile review articles to see this conflict play out. 

As a passionate microbiome researcher, I like to highlight the hope that I see -- the hope that humans will be able to understand and harness the microbiome to improve human health. 

The story of hope I have for you today is a story of the heart. The human heart. Well, heart disease. Reducing heart disease, really.

Setup

When I was in graduate school I saw the most fascinating lecture. It was from Stanley Hazen, a researcher at the Cleveland Clinic, and he was describing an experiment in which it appeared that bacteria in the gut were responsible for converting a normal part of our diet into a molecule that promoted atherosclerosis (heart disease). With a combination of (1) molecular analysis of the blood of humans with heart disease and (2) experiments in mice varying the diet and microbes present in the gut, they showed pretty convincingly that bacteria were converting phosphatidylcholine from food into TMAO, which then promoted heart disease (Wang, et al. 2011 Nature). 

Payoff

Fast forward 7 years, and the microbiome research field has advanced far enough to identify the exact bacterial genes involved in this process. Not only that, they are able to inhibit those specific bacterial enzymes and show in a mouse model that levels of harmful TMAO are pushed down as a result (Roberts, et al. 2018 Nature).

Fig. 5: A microbial choline TMA lyase inhibitor reverses diet-induced changes in cecal microbial community composition associated with plasma TMAO levels, platelet responsiveness, and in vivo thrombosis potential. Schematic of the relationship …

Fig. 5: A microbial choline TMA lyase inhibitor reverses diet-induced changes in cecal microbial community composition associated with plasma TMAO levels, platelet responsiveness, and in vivo thrombosis potential. Schematic of the relationship between human gut commensal choline TMA lyase activity, TMA and TMAO generation, and enhanced platelet responsiveness and thrombosis risk in the host

Bioinformatics Aside

One aspect of this story that I'll point out for the bioinformatics folks in the audience is that the biological mechanism involved in choline -> TMAO is not a phylogenetically conserved one. It is mediated by a set of genes that are distributed sporadically across the bacterial tree of life. For that reason and others, I am a strong supporter of microbiome analysis tools that enable gene-level comparison between large sets of samples in order to identify mechanisms like these in the future. 

Summary

My hope, my dream, is that the entire human microbiome field is able to eventually follow this path. We observe that the microbiome influences some aspect of human health, we identify the biological mechanism responsible for this effect, and then we demonstrate our knowledge and mastery of this biology to such an extent that we can intentionally manipulate this system and eventually improve human health. 

We have a long way to go, but I believe that this is the path that we can follow, the example we can aspire to. I hope that this story gives you hope, and helps cut through the hype. 

Update on Making CAGs, or The Importance of Good Software

I wrote a little bit recently on why I am so interested in making CAGs from metagenomic data, and I wanted to provide a little update on that topic.

CAGs are "Co-Abundant Genes," which is to say the groups of genes which are found at similar abundances in metagenomic data across many different samples. The inference from the "co-abundance" observation is that those genes are likely present on the same bits of DNA (i.e. chromosomes) across those samples. I am particularly interested in these groups of genes because of the highly mosaic nature of microbial genomic evolution.

Having spent a bit of time on maximizing the computational efficiency of finding CAGs, I have been struck by just how hard it is. Naively, the core computational task requires calculating a similarity (or co-abundance) metric for every pair of genes, which scales exponentially with the number of genes. For 100 genes there are ~5,000 comparisons, for 1,000 genes there are ~500,000, for 10,000 genes there are ~50,000,000 comparisons, etc. etc.

Speaking practically, this means that it takes a long time on a very large computer to get this work done. There are all sorts of tricks to make it faster, including parallelization, code optimization, etc., but at the core it is just a hard task.

However, I happened to ask the Twitter hive mind for help, and Andrew Carroll happened to give me some great advice:

This lead me down the road of exploring the Approximate Nearest Neighbor algorithms. It turns out that there a number of different algorithms out there which approximate this task of finding the closest set of points in highly dimensional space, which is exactly what I needed to make CAGs. There's even a website showing you which of these pieces of code work the best.

Interestingly, one of these algorithms (called "annoy") was produced by Spotify, and can be used to rapidly find the nearest neighbor from a large index that can be mmapped for rapid access across multiple threads.

Annoy (Approximate Nearest Neighbors Oh Yeah) 

In Closing

The point I want to reinforce is that Good Software matters. Implementing an exact solution was taking me 10 days with an expensive 72 core machine, which gave me little opportunity to iterate over different variables or analyze new datasets quickly. The advantage of using a better piece of software is not just that I can make pretty figures, it's that I can actually do science more quickly, spending less money, and getting more accurate answers. I didn't know that this software was out there, and so it wasn't until I asked some people on Twitter for me to find out about it. But now that I know I'm happy to tell the world to give it a try, and hopefully that will save you all some time, some money, and help you find out the answer to whatever questions are important.

Hybrid Approach to Microbiome Research (to Culture, and Not to Culture)

I was rereading a great paper from the Huttenhower group (at Harvard) this week and I was struck by a common theme that it shared with another great paper from the Segre group (at NIH), which I think is a nice little window into how good scientists are approaching the microbiome these days. 

The paper I'm thinking about is Hall, et al. A novel Ruminococcus gnavus clade enriched in inflammatory bowel disease patients (2017) Genome Medicine. The paper is open access so you can feel free to go read it yourself, but my super short summary is: (1) they analyzed the gut microbiome from patients with (and without) IBD and found that a specific clade of Ruminococcus gnavus was enriched in IBD; and then (2) they took the extra step of growing up those bacteria in the lab and sequencing their genomes in order to figure out which specific genes were enriched in IBD. 

The basic result is fantastically interesting – they found enriched genes that were associated with oxidative stress, adhesion, iron acquisition, and mucus utilization, all of which make sense in terms of IBD – but I mostly want to talk about the way they figured this out. Namely, they took a combined approach of (1) analyzing the total DNA from stool samples with culture free genome sequencing, and then (2) they isolated and grew R. gnavus strains in culture from those same stool samples so that they could analyze their genomes.

Fig. 3: R. gnavus metagenomic strain phylogeny. 

Fig. 3: R. gnavus metagenomic strain phylogeny. 

Now, if you cast your mind back to the paper on pediatric atopic dermatitis from Drs. Segre and Kong (Byrd, et al. 2017 Science Translational Medicine) you will remember that they took a very similar approach. They did culture-free sequencing of skin samples, while growing Staph strains from those same skin samples in parallel. With the cultures in hand they were able to sequence the genomes of those strains as well as testing for virulence in a mouse model of dermatitis.

So, why do I think this is worth writing a post about? It helps tell the story of how microbiome research has been developing in recent years. At the start, all we could do was describe how different organisms were in higher and lower abundance in different body sites, disease states, etc. Now that the field has progressed, it is becoming clear that the strain-level differences within a given species may be very important to human health and disease. We know that although people may contain a similar set of common bacterial species, the exact strains in their gut (for example) are different between people and usually stick around for months and years. 

With this increased focus on strain-level diversity, we are coming up against the technological challenges of characterizing those differences between people, and how those differences track with health and disease. The two papers I've mentioned here are not the only ones to take this approach (it's also worth mentioning this great paper on urea metabolism in Crohn's disease from UPenn), which was to neatly interweave the complementary sets of information that can gleaned from culture-free whole-genome shotgun sequencing as well as culture-based strain isolation. Both of those techniques are difficult and they require extremely different sets of skills, so it's great to see collaborations come together to make these studies possible.

With such a short post, I've surely left out some important details from these papers, but I hope that the general reflection and point about the development of microbiome research has been of interest. It's certainly going to stay on my mind for the years to come.

Notes on identifying Co-Abundant Genes

One of the challenges in the field of microbial metagenomics (part of microbiome research) is going from the "bag-of-genes" stage to something more closely resembling biological reality. One of the general approaches that I have always found very compelling is to identify sets of genes that occur at a similar abundance across multiple samples, so-called Co-Abundant Genes (CAGs). In this post I will quickly describe why I like CAGs, and then talk about how I've been approaching the computational challenges associated with identifying them.

Why I like CAGs

The idea of CAGs is very appealing to me because it sits nicely between the level of a single gene and that of a complete genome. It is useful to track collections of genes because of the modular structure of bacterial genomes. As bacteria evolve they can frequently gain or lose large regions containing multiple genes, which may be due to a number of different biological mechanisms including plasmids, phage, transposons, or even just homologous recombination. Therefore it is useful to identify those cases when groups of genes are always observed together at a similar abundance, because it suggests that those genes are almost always found on the same chromosome and can be grouped together as a biologically meaningful entity.

Tackling the challenges of CAGs

The challenges of building CAGs are entirely computational, and are due to the extremely large number of genes that can be observed during metagenomic experiments.

The operation of finding CAGs can be broken into the following steps:

  1. Calculate a co-abundance metric for each pair of genes
  2. Identify those groups of genes which have a high degree of co-occurrence
  3. Validate that those CAGs are biologically meaningful

All of those steps are totally reasonable and work cleanly using off-the-shelf tools in Python or R when you have small numbers of genes (< 1,000). However, once you start having 100,000's and 1,000,000's of genes, the default tools for steps 1 and 2 will either instantly break or take forever. It's not surprising that making a pairwise distance matrix for ~1e6 by ~1e6 would break your computer -- it's got ~1e12 cells of data!

Here is how I have been tackling these challenges:

  1. Throw away most of the distance metrics. Instead of calculating all of the pairwise distances in a single matrix, iterate over all of the combinations and only store those values which are below some threshold.
  2. Use as many processors as possible. Distribute the process over many cores and run this on as big of a machine as you can find.
  3. Use iterators instead of making lists. This is more of a Python-specific note, but instead of iterating over a list of all of the pairwise combinations, make a function that yields each successive combination so that you never have to load the NxN list into memory.
  4. Cluster the quick and dirty way with single-linkage. There are many different clustering approaches that you could use, but single-linkage is incredibly simple and completely avoids the all-by-all comparison. It can be done with a streaming approach, which helps make this even halfway possible.

The last tip here is use other people's code. You're always going to have to write some code from scratch, but try to copy as much as you can from existing (open source) projects. To this end, I have been working on this problem in a public GitHub repository, and I'd be more than happy for anyone to swipe whatever bits of my code might be useful. I don't expect that anyone else has their data in exactly the way I expect, so it might be best to start with the two core functions, one which generates all of the pairwise connections from a Pandas DataFrame, and another which uses single-linkage clustering to identify CAGs from those connections. This code is not published, it's not heavily tested, and it might not even be terribly readable, but it might still be useful if this is a project you find yourself tackling.

Happy hunting.

Tracking outbreaks with whole-genome sequencing

What is "Genomic Epidemiology"?

The last ten years have seen a number of astonishing advances in our ability to track the spread of outbreaks using something called "genomic epidemiology." The basic concept here is that the pathogens that make us sick (bacteria, viruses, fungi, etc.) each have their own genome, which can be used to trace their ancestry in much the same way that we can use our own genomes to trace our own ancestry. 

Just like you can use the human genome to get an idea of how people are related to each other, you can use the microbial genomes to get an idea of how pathogens are related to each other, and therefore how they are spreading between people. 

Making sense of tons of data

Without doing a comprehensive survey, I will just say that a number of very smart and capable people have been working on all of the different steps of the process – isolating the pathogen's genome, sequencing it quickly, and comparing those genome sequences to each other. What I wanted to focus on was the final step: taking all of those genomes and getting an idea of what is actually happening. I was inspired here by the NextStrain project, which takes large numbers of genomes for something like Zika and provides an intuitive means for figuring out what's going on. 

For my own exploration, I used the data published by Roach, et al. (2015) as they sequenced every single isolate that came through an ICU over the course of a year. I should mention that the laboratory protocols necessary to achieve such a feat are very impressive.

Careful analysis of individual outbreaks involved a number of involved steps to reconstruct bacterial genomes and compare isolates at single-nucleotide resolution. Instead, my goal was to see how quickly I could take the raw data and get an idea of whether there were any clusters that would merit further in-depth investigation (were this an actual surveillance project). 

Since all of the raw data was available on SRA, I simply (1) downloaded the raw data with fastq-dump, (2) made MinHash sketches with Finch-rs, (3) calculated pairwise distances between all isolates, (4) performed Ward hierarchical clustering (the neighbor joining tree was too slow), and (5) output a Newick file with the resulting tree structure. I didn't keep track of how long each step took, but start to finish it all took me about 5 hours to finish (including the time spent reading documentation, as well as raw compute). 

So here's an example of what that dataset looks like, and here is an interactive link

Overall view of 1262 isolates collected over 1 year in an ICU (Roach, et al. 2015)

Overall view of 1262 isolates collected over 1 year in an ICU (Roach, et al. 2015)

Zoomed-in view of a clade including Acinetobacter (red), Haemophillus (green), Moraxella (teal), and Neisseria (blue). The rollover text shows metadata for sample 583, which was sampled from the same patient as its closest neighbor in the tree, samp…

Zoomed-in view of a clade including Acinetobacter (red), Haemophillus (green), Moraxella (teal), and Neisseria (blue). The rollover text shows metadata for sample 583, which was sampled from the same patient as its closest neighbor in the tree, sample 595.

Disclaimer: None of the clades shown above indicate bona fide outbreak clusters without further quality control, whole genome alignment, and inspection by a qualified professional.

I encourage you to follow the link and explore the tree – it's interesting to see how all of the data comes together. A bunch of different species are included on the same tree, which is one of the nice things about using MinHash sketches to compare genomes (you don't need to align to a common genome). When you roll your mouse over each branch you can see the metadata that the authors published for each isolate.

Take home

So what is the point here? (1) genome sequencing can be used to precisely identify closely-related bacterial isolates, (2) the community (FDA, PHE, CDC, etc.) has taken massive strides to integrate this technology into routine public health surveillance, and (3) relatively simple computational approaches can be used to quickly sift through the data to find groups that merit further inspection.

I also wanted to point out that all of the challenges associated with genome assembly and multiple sequence alignment can be entirely sidestepped by the MinHash approach, which makes it a lot easier to scale these processes up. The analysis methods also don't require a ton of compute – it's actually harder to just keep track of all the data and visualize it in a nice way than it is to compute the pairwise distances. 

So, if you're thinking about processing large collections of isolates to find potential outbreak clusters, ask a bioinformatician if MinHash might be right for you.


More Reading:

Application of whole-genome sequencing for bacterial strain typing in molecular epidemiology

Whole Genome Sequencing for the Retrospective Investigation of an Outbreak of Salmonella Typhimurium DT 8

Bacterial genome sequencing in clinical microbiology: a pathogen-oriented review 

Practical Value of Food Pathogen Traceability through Building a Whole-Genome Sequencing Network and Database

Infection control in the new age of genomic epidemiology

Some MinHash implementations:

Disclosure:

I used to work for and have an interest in One Codex, the group which developed the open source implementation of MinHash (finch-rs) that I used in this little exercise.

Functional Analysis of Metagenomes by Likelihood Inference: FAMLI

I've been working for the last six months or so with my colleague Dr. Jonathan Golob on an algorithm to help analyze microbiome samples, and now it's ready to share with the world. 

If you'd like to read a preprint of the paper instead of this blog-based summary, you can do so on bioRxiv.

The problem

As we were analyzing a set of microbiome samples using shotgun genomes sequence data (WGS), we kept running into a tricky problem. Our goal was to identify the set of protein coding genes present in a sample, and so we aligned the WGS reads using DIAMOND against the UniRef90 database and took the best hit(s) for each read. However, we kept getting all sorts of false positives and false negatives, which we ultimately figured out were due to a) sequencing error and b) large regions of identical protein sequence shared between different proteins in the database. In fact, (b) was far more concerning to us than (a) because it meant that we were doing better or worse depending on the quality of annotation for an organism's genome. This was an analytical bias we didn't want in our research.

The solution

After lots of back-and-forth between the two of us, including discussion, arguments, coding, refactoring, and existential crises (on my part), we ended up putting together an algorithm that I'm very happy with. This is not the most efficient or accurate version that is theoretically possible, but it's the best one that we were able to put together after trying lots and lots of variations. The approach is illustrated here:

Illustration of the FAMLI algorithm

Illustration of the FAMLI algorithm

The steps are generally as follows:

  1. Align every WGS read against a database of protein references (e.g. UniRef90)
  2. Identify the protein references with highly uneven coverage (standard deviation / mean > 1) and filter them out
  3. Iteratively assign each read to a single protein reference, that which is the most likely given the complete set of reads in the sample
  4. Filter the final set of protein references as in (2), using the deduplicated alignments from (3).

We did some work to test how this approach compares to other potential options, and we think it does quite well. You can read the paper for more details on that.

The software

We would like for this approach to be generally available for use by the research community. You can read the source code on GitHub, you can download a Docker image from Quay, and you can install directly from PyPI. Of the three, I suggest you just use the Docker image to minimize any confusion or unpredictability.

Thinking broadly about functional metagenomics

As we worked on benchmarking this algorithm we felt that it was necessary to compare it with other existing methods that are used by the community, but I didn't want to give the impression that this algorithm is intended to replace or supplant any previously existing tools. That's because the goal of this analysis is subtly different than that of other methods. To date, functional metagenomics has generally had the goal of identifying the metabolic pathways encoded by a community (e.g. HUMAnN2) or identifying the complete gene catalog that can be assembled from a community (e.g. de novo assembly). I think that both of those methods work very well for those useful purposes. In contrast, FAMLI attempts to quantify the set of protein-coding genes from a closed reference database (e.g. UniRef90), whether or not they have any annotated metabolic function. In fact, one of the more interesting possibilities would be to incorporate this open source algorithm into those existing tools, using it to optimize any alignments that are created as part of a larger pipeline. If you are a tool maker and are interested in working on that together, please be in touch.

Final note

Working on this project has been an extremely challenging and rewarding process, full of false starts, confusion, and discovery. I cannot be more thankful to Dr. Jonathan Golob for his equal contribution to this effort, and am also thankful for any readers who have been interested enough by our work to read this far. I hope that you find some utility from our efforts.

Journal Club: GraftM, a tool for scalable, phylogenetically informed classification of genes within metagenomes

A paper recently caught my eye for two reasons: (1) it implemented an idea that someone smart recently brought up to me and (2) it perfectly illustrates the question of "functional resolution" that comes up in the functional analysis of metagenomes.

The paper is called GraftM: a tool for scalable, phylogenetically informed classification of genes within metagenomes, by Joel A. Boyd, Ben J. Woodcroft and GeneW. Tyson, published in Nucleic Acids Research.

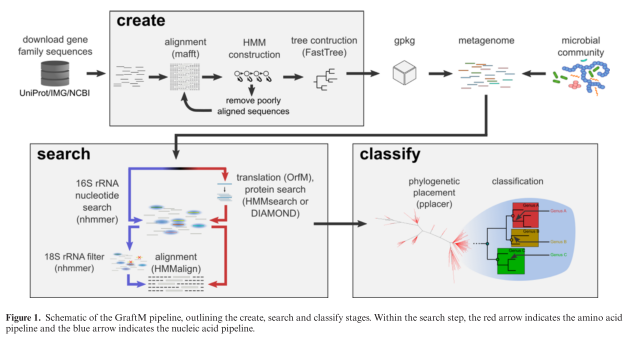
The tool that they present is called GraftM, and it does something very clever (in my opinion). It analyzes DNA sequences from mixtures of microbes (so-called "metagenomes" or microbiome samples) and it identifies the allele of a collection of genes that is present. This is a nice extrapolation of the 16S classification process to include protein-coding sequences, and they even use the software package pplacer, which was developed for this purpose by Erick Matsen (Fred Hutch). Here's their diagram of the process:

Screen Shot 2018-03-28 at 12.36.25 PM.png

They present some nice validation data suggesting that their method works well, which I won't reproduce here except to say that I'm always happy when people present controls. 

Now instead of actually diving into the paper, I'm going to ruminate on the concept that this approach raises for the field of functional metagenomics.

Functional Analysis

When we study a collection of microbes, the "functional" approach to analysis considers the actual physical functions that are predicted to be carried out by those microbes. Practically, this means identifying sets of genes that are annotated with one function or another using a database like KEGG or GO. One way to add a level of specificity to functional analysis is to overlay taxonomic information with these measurements. In other words, not only is Function X encoded by this community, we can say that Function X is encoded by Organism Y in this community (while in another community Function X may be encoded by Organism Z). This combination of functional and taxonomic data is output by the popular software package HUMAnN2, for example. 

Let's take a step back. I originally told you that protein functions were important (e.g. KEGG or GO labels), and now I'm telling you that protein functions ~ organism taxonomy is important. The difference is one of "functional specificity."

Functional Specificity

At the physical level, microbial communities consist of cells with DNA encoding RNA and producing proteins, with those RNA and protein molecules doing some interesting biology. When we summarize those communities according to the taxa (e.g. species) or functions (e.g. KEGG) that are present, we are taking a bird's eye view of the complexity of the sample. Adding the overlay of taxonomy ~ function (e.g. HUMAnN2) increases the specificity of our analysis considerably.

Now take a look at the figure above. You can see that a single KEGG group actually consists of a whole family of protein sequences which have their own phylogenetic relationships and evolutionary history. This tool (GraftM) presents a means of increasing the level of functional resolution to differentiate between different protein sequences (alleles) that are contained within a single functional grouping (e.g. KEGG label). However, it should be noted that this approach is much more computationally costly than something like HUMAnN2, and is best run on only a handful of protein families at a time. 

Summary

Lastly, let me say that there is no reason why a higher or lower level of functional specificity is better or worse. There are advantages at both ends of the spectrum, for computational and analytical reasons that would be tiresome to go into here. Rather, the level of functional specificity should be appropriate to the biological effect that you are studying. Of course, it's impossible to know exactly what will be the best approach a priori, which is why it's great to have a whole collection of tools at your disposal to test your hypothesis in different ways. 

Detecting viruses from short-read metagenomic data

My very first foray into the microbiome was in graduate school when my advisor (Dr. Rick Bushman) suggested that I try to use a high-throughput genome sequencing instrument (a 454 pyrosequencer) to characterize the viruses present in the healthy human gut. That project ended up delving deeply into the molecular evolution of bacteriophage populations, and gave me a deep appreciation for the unpredictable complexity of viral genomes. 

While I wasn't the first to publish in this area, the general approach has become more popular over the last decade and a number of different groups have put their own spin on it. 

Because of the diversity of viruses, you can always customize and enhance different aspects of the process, from sample collection, purification, and DNA isolation to metagenomic sequencing, bioinformatic analysis, and visualization. It's been very interesting to see how sophisiticated some of these methods have become.

On the bioinformatic analysis side of things, I ended up having the most success in those days by assembling each viral genome from scratch and measuring the evolution of that genome over time. More of the bespoke approach to bioinformatics, rather than the assembly line. 

In contrast, these days I am much more interested in computational approaches that allow me to analyze very large numbers of samples with a minimum of human input required. For that reason I don't find de novo assembly to be all that appealing. It's not that the computation can't be done, it's more than I have a hard time imagining how to wrap my brain around the results in a productive way. 

In contrast, one approach that I have been quite happy with is also much more simple minded. Instead of trying to assemble all of the new genomes in a sample, it's much easier to simply align your short reads against a reference database of viral genomes. One of the drawbacks is that you can only detect a virus that has been detected before. On the other hand, one of the advantages is also that you can only detect a virus that has been detected before, meaning that all samples can be rapidly and intuitively compared against each other. 

To account for the rapid evolution of viral genomes, I think it's best to do this alignment in protein space against the set of proteins contained in every viral genome. This makes the alignments a bit more robust. 

If you would like to perform this simple read alignment method for viral detection, you can use the code that I've put together at this GitHub repo. There is also a Quay repository hosting a Docker image that you can use to run this analysis without having to install any dependencies. 

This codebase is under active development (version 0.1 at time of writing) so please be sure to test carefully against your controls to make sure everything is behaving well. At some point I may end up publishing more about this method, but it may be just too simple to entice any journal. 

Lastly, I want to point out that straightforward alignment of reads does not account for any number of confounding factors, including but not limited to:

  1. presence of human or host DNA
  2. shared genome segments between extant viruses
  3. novel viral genomes
  4. complex viral quasi-species
  5. integration of prophages into host genomes

There are a handful of tools out there that do try to deal with some of those problems in different ways, quite likely to good effect. However, it's good to remember that with every additional optimization you add a potential confounding factor. For example, it sounds like a good idea to remove human sequences from your sample, but that runs the risk of also eliminating viral sequences that happen to be found with the human genome, such as lab contaminants or integrated viral genome fragments. There are even a few human genes with deep homology to existing viral genes, thought to be due to an ancient integration and subsequent repurposing. All I mean to say here is that sometimes it's better to remove the assumptions from your code, and instead include a good set of controls to your experiment that can be used to robustly eliminate signal coming from, for example, the human genome. 

Journal Club: Discovering new antibiotics with SLAY

This paper is a bit of a departure for me, but even though it's not a microbiome paper it's still one of the most surprising and wonderful papers that I've seen in the last year, so bear with me.

We're looking at Tucker, et al. "Discovery of Next-Generation Antimicrobials through Bacterial Self-Screening of Surface- Displayed Peptide Libraries" Cell 172:3, 2018. (http://www.cell.com/cell/fulltext/S0092-8674(17)31451-4).

When I first learned about this project, I said, "That's a fun idea, but it won't possibly work," to which the PI responded, "We've already done it." 

The extremely cool idea here was to rapidly discover new antibiotics by quickly screening an immense library of novel peptides. The diagram below lays it out: they created a library of peptides, expressed those peptides on the surface of E. coli, and then used genome sequencing to figure out which of those peptides were killing the bacteria. The overall method is called SLAY, which exceedingly clever.

fx1.jpg

While this idea seems simple, there are more than a few parts that I thought would be impossibly difficult. They include (a) building a sufficiently large library of peptides, (b) expressing those peptides on the surface of the bacteria and not inside the cell, and (c) making sure that the peptides were only killing the cells they were tethered to and not any neighbors. 

I won't go through the entire paper, but I will say that the authors ended up doing quite a bit of work to convince the readers that they actually discovered new antimicrobial peptides, and that they weren't observing some artifact. At the end of the day it seems pretty irrefutable to me that they were able to use this entirely novel approach in order to identify a few new antibiotic candidates, which typically takes hundreds of millions of dollars and decades of work. 

In short, it looks like smart people are doing good work, even outside of the microbiome field. I'll definitely be keeping an eye on these authors to see what they come up with next!