Reactive Dashboards in the Browser (Without Writing JavaScript)

Things have gotten weird. With AI tools available, I find that I can build things I never really could before — web apps and tools in languages I never wanted to touch before. The range of what one person can put together has gotten a lot wider, and I think we’re all still figuring out how to adjust.

Speaking for myself, it used to be that building the thing was the barrier, and now I think the harder question is knowing what to build in the first place — where to actually point our prompts and tokens so that you end up with something useful instead of another half-baked idea.

If you're looking for somewhere to explore next, here's my suggestion: build a dashboard with Observable Framework.

I've spent a fair amount of time over the last year telling people about marimo, a reactive notebook for Python that I've become a bit of a broken record about. Observable is sort of the older relative of marimo — same reactive idea, but living in the web browser instead — and for the kind of AI-assisted tinkering I'm describing, it turns out to be a really good fit.

Compared to the languages I’m most comfortable with (Python and R), one of the things I like most about any JavaScript-based tool is just that the code runs in the browser. Everybody already has a browser, which sounds obvious but it's a big deal when you think about how hard it is to get someone else to run your fancy new tool using Python/R/Docker. When I want to share a result with a collaborator, I don't have to walk them through installing anything or ask which version of Python they happen to have — I can send them a link and it opens on their laptop or their phone and that's the end of it. For sharing scientific work, that ends up being really valuable.

What Do I Mean by "Reactive"?

Reactive — a style of programming where the system keeps track of which parts of your code depend on which other parts, and automatically re-runs the parts that need updating when something changes. You describe how things relate to each other, and it works out the order so you don't have to.

If you've spent most of your time in R or Python scripts, this takes a bit of getting used to. In a normal script/notebook the order matters a lot — line 40 needs to run after line 39, or things break. In a reactive setup you stop thinking about order. You just say that this plot depends on this slider, and then when the slider moves the plot updates on its own. You never have to lay out that dependency graph yourself; the runtime infers it while the code is running.

Marimo does the same thing over in Python. For me it's the part that makes both of them feel a bit different from normal coding — the relationships are inferred directly from the code and then you just watch it keep itself in sync.

Where the Idea Came From

I actually first heard about Observable back when I was getting into marimo. The marimo folks talked about having been inspired by it, but at the time it didn't really register. Observable meant writing JavaScript, and I wasn't confident enough to write much of anything in JS, so I sort of filed it away and never looked any closer. It's only more recently, with an assistant to lean on, that going back to the original felt like something I could actually do.

Under the hood they're doing a similar thing with that dependency graph. Where they really differ is in the language you write and in how you get the finished thing out to other people, and that difference matters more than you'd think.

Same Idea, Different Trade-offs

Marimo is Python, which makes it really fun to write if Python is already the language you think in (and if you’ve come up against the pain points of Jupyter). The tricky part is sharing it. Browsers don't run Python on their own, so to put a marimo app in front of someone you either have to run a server for it or bundle up the whole Python runtime and ship it into the browser with something like Pyodide. Both of those work fine, but they each have their own hassles.

Observable is JavaScript, so it just runs in the browser directly, with nothing sitting behind it. An Observable Framework project compiles down to ordinary static files — HTML, CSS, and JavaScript — that you can host just about anywhere, whether that's S3 or GitHub Pages or some cheap static host, with no server to keep running. I've spent an embarrassing amount of my career building static-site tooling to avoid running servers, so this is exactly the kind of thing I tend to get excited about.

So roughly speaking, marimo is easier to write and Observable is easier to share, and which of those matters more really just depends on what you're making and who needs to see it in the end.

Where the Data Comes In

For actual day-to-day work, though, the reactivity on its own isn't really the selling point for me. What I care about is what happens when you hook that reactivity up to a real dataset, and that's where a library called Mosaic comes in.

Mosaic wires your plots up to DuckDB, which can actually run right inside the browser through WebAssembly. So instead of dumping your entire dataset into JavaScript and making the browser chew through all of it, Mosaic hands the filtering and aggregation off to DuckDB and only draws whatever it needs at the moment. In practice that means you can cross-filter a chart sitting on top of a pretty large table and have it stay responsive, which would have been painfully slow in a browser not that long ago. When you drag a selection on one plot, the linked plots re-query the database and update, rather than slogging through a giant array loaded into memory.

Take Home: if you're trying to build a dashboard on top of data that's a bit too big to sit comfortably in a normal web page, the pairing of Observable's reactivity with Mosaic pushing the heavy lifting down to DuckDB is, in my opinion, a really nice way to go about it.

"But I Don't Write JavaScript"

For a lot of the people I talk to — scientists and analysts who mostly live in R or Python — the JavaScript thing has always been where the conversation ends. Observable is JavaScript, they don't write JavaScript, and so they never look any further. One of my closest collaborators tried to convince me to try JavaScript for years, and I always resisted.

And that's the barrier I think has mostly come down. A decent AI coding assistant is quite good at exactly this sort of thing — setting up a small web project, getting a plot working, fixing the layout, or just explaining what some error message actually means. Knowing JavaScript inside and out used to be the entry fee for any of this, and I don't really think it is anymore.

So we're back to that same question of what to actually build. If the building is mostly handled for you now, the more interesting problem is where to aim, and I think Observable is one of the better places to try. The documentation is good, and the whole thing happens to fit how an AI assistant likes to work, so you can lean on it for the JavaScript parts you don't know. You end up writing less code than you'd guess — a lot of it is just Markdown with small bits of JavaScript mixed in — and what you get at the end is a static site you can put anywhere.

Where to Start

If you want to actually try this out, here's roughly where I'd start:

  1. Skim through the Observable Framework docs. The getting-started walkthrough is pretty approachable.

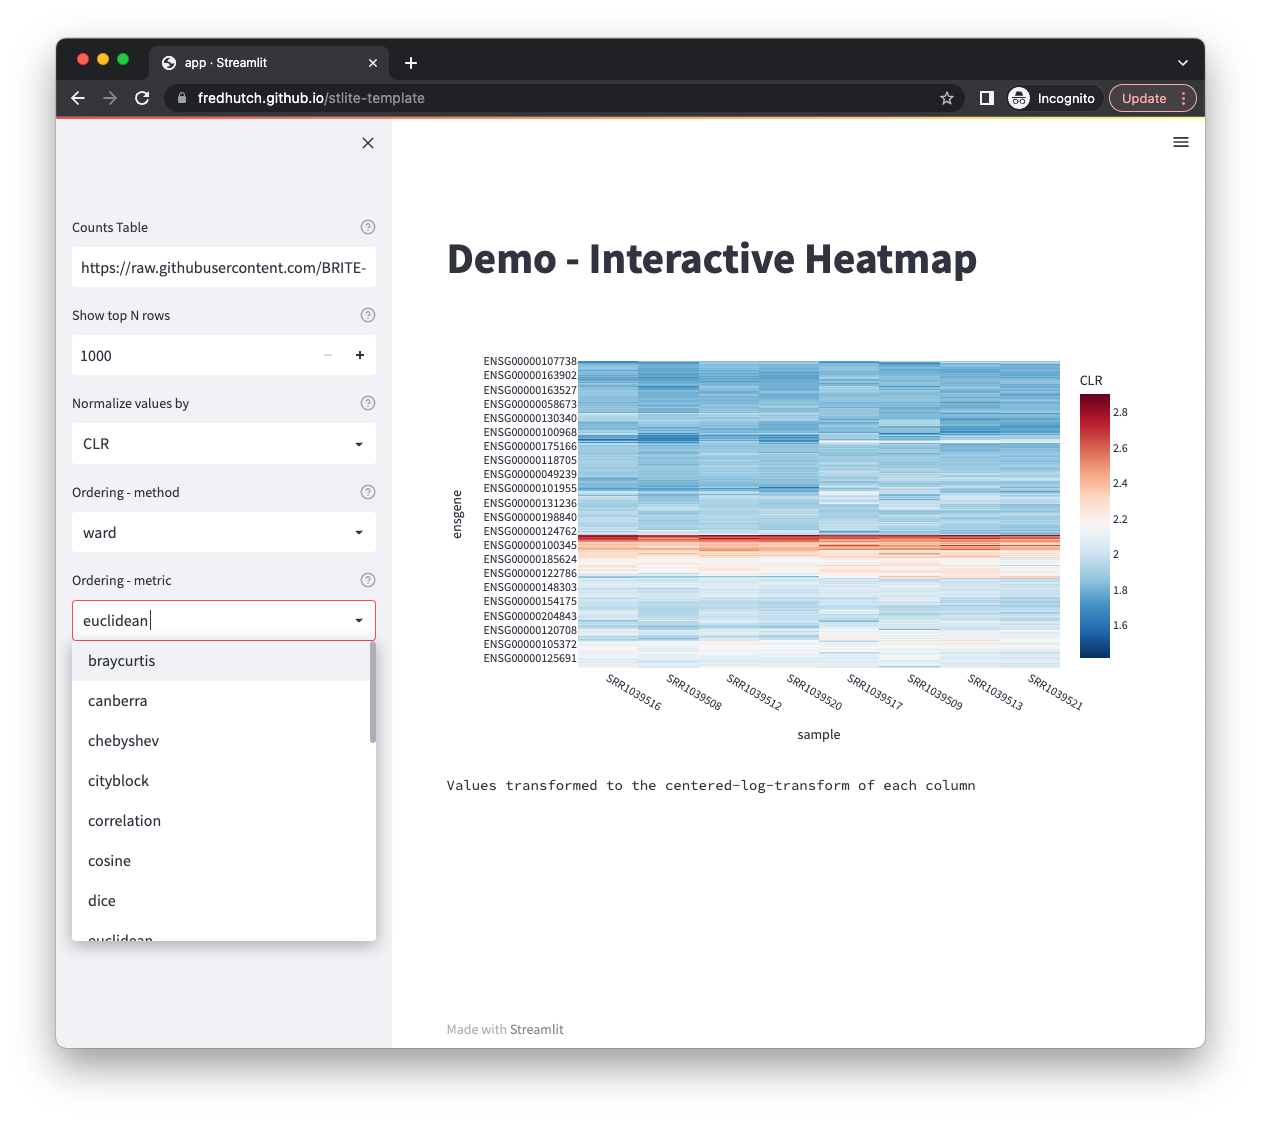
  2. Have a look at one of the Mosaic examples so you can see the big-dataset cross-filtering working, and get a sense of what you're aiming at.

  3. Grab a small dataset of your own and ask your AI assistant to help you build a single interactive chart from it. Just start with one, get it working, and then add another once it does.

The point of a first attempt isn't really to get good at any of this. It's mostly just to get to the moment where you move some control on the page and everything else updates along with it, and you notice that you never actually had to connect those pieces together yourself. I've built a fair number of these by now, and that bit still gets me a little.

—-

If you've been curious about marimo, or about building for the web in general, or you're just tired of exporting static PNGs to drop into slides, I'd really encourage you to give Observable a try. The wall that used to keep the browser out of reach for people who don't write JavaScript is a lot lower now than I think most people realize. Your time and attention are appreciated, as always, dear reader — and if you do end up building something, please be in touch, I'd love to see it.

Publish Interactive Data Visualizations for Free with Python and Marimo

Working in data science, it can be hard to share insights from complex datasets using only static figures. All the facets that describe the shape and meaning of interesting data are not always captured in a handful of pre-generated figures. While we have powerful technologies available for presenting interactive figures — where a viewer can rotate, filter, zoom, and generally explore complex data  —  they always come with tradeoffs.

I recently wrote up an article for Towards Data Science presenting my experience using a recently released Python library — marimo — which opens up exciting new opportunities for publishing interactive visualizations across the entire field of data science.

Towards Data Science: Publish Interactive Data Visualizations for Free with Python and Marimo

Click on the image to open the app for yourself

Python-Based Data Viz (With No Installation Required)

In my work I’m constantly trying to find better ways to communicate the results of complex analyses to users, whether they are other scientists or the general public. As the tools for delivering sophisticated apps via the web have become better and better, it has even become possible for someone like me (who is not a web developer) to package up my Python code to be run directly in the web browser.

To try to help other people adopt this technique, I wrote a short tutorial which is now available on Towards Data Science:

https://towardsdatascience.com/python-based-data-viz-with-no-installation-required-aaf2358c881


Dispatches from the microbial frontier of cancer research

One of the aspects of my job that I enjoy the most is being able to support the stellar researchers working here at the Fred Hutch Cancer Center. My own personal goal is that my work analyzing data from the human gut microbiome will one day be used to improve the tools we have for preventing and treating cancer. As part of that effort, I have been collaborating with a brilliant physician-scientist, Dr. Neel Dey, who combines his clinical practice with a biomedical research program to identify the ways in with the microbiome influences colorectal cancer.

Our work together was recently featured in an article by Sabin Russell from the Fred Hutch press office, which I thought did a great job of capturing our recent advances.

Dispatches from the microbial frontier of cancer research


Microbial Pan-Genome Cartography

Many of the projects that I’ve been working on recently have led me to ask questions like, ”what bacteria encode this group of genes?” and “what genes are shared across this group of bacteria?” Even for a single species, the patterns of genes across genomes can be complex and beautiful!

Update: All of the maps shown below can now be viewed interactively here.

To make it easier to generate interactive displays to explore these patterns (which I call “genes-in-genomes maps”), I ended up building out a collection of tools which I would love for any researcher to use.

To explain a bit more about this topic, I recorded a short talk based on a presentation I gave at a local microbiome interest group.

In the presentation I walk through a handful of these pan-genome maps, which you can also download and explore for yourself using the links below.

I’m excited to think that this way of displaying microbial pan-genomes might be useful to researchers who are interested in exploring the diversity of the microbial world. If you’d like to talk more about using this approach in your research, please don’t hesitate to be in touch.

Looking Under the Lamppost - Reference Genomes in Metagenomics

In the world of research, a phrase that often comes up is “looking under the lamppost.” This refers to the fundamental bias in which we are more likely to pay attention to whatever is illuminated with our analytical methods, even though it might not be the most important. This phrase always comes into my mind when people are discussing how to best use reference genomes in microbial metagenomics, and I thought that a short explanation might be worthwhile.

The paper which prompted this thought was a recent preprint "OGUs enable effective, phylogeny-aware analysis of even shallow metagenome community structures” (https://www.biorxiv.org/content/10.1101/2021.04.04.438427v1). For those who aren’t familiar with the last author on this paper, Dr. Rob Knight is one of the most published and influential researchers in the microbiome field and is particularly known for being at the forefront of the field of 16S analysis with the widely-used QIIME software suite. In this paper, they describe a method for analyzing another type of data, whole-genome shotgun (WGS) metagenomics, which is based on the alignment of short genome fragments to a collection of reference genomes.

Rather than focus on this particular paper, I would rather spend my short time talking about the use of reference genomes in metagenomic analysis in general. There are many different methods which use reference genomes in different ways. This includes alignment-based approaches like the OGU method as well as k-mer based taxonomic classification, which is one of the most widely used approaches to WGS analysis. There are many bioinformatic advantages of using reference genomes, including the greatly increased speed of being able to analyze new data against a fixed collection of known organisms. The question really comes down to whether or not we are being misled by looking under the lamppost.

To circle back around and totally unpack the metaphor, the idea is that when we analyze the microbiome on the basis of a fixed set of reference genomes we are able to do a very good job of measuring the organisms that we have reference genomes for, but we have very little information about the organisms which are not present in that collection. Particular bioinformatics methods are influenced by this bias to different degrees depending on how they process the raw data, but the underlying principle is inescapable.

The question you might ask is, “is it a good idea for me to use a reference-based approach in my WGS analysis?” and like most good questions the answer is complex. In the end, it comes down to how well the organisms that matter for your biological system have been characterized by reference genome sequencing. Some organisms have been studied quite extensively, and the revolution in genome sequencing has resulted in massive numbers of microbial reference genomes in the public domain. In those cases, using reference genomes for those organisms will almost certainly give you higher quality results than performing your analysis de novo.

The harder question to answer is what organisms matter to your biological system. In many cases, for many diseases, we might think we have a very good idea of what organisms matter. However, one of the amazing benefits of WGS data is that it provides insight into all organisms in a specimen which contain genetic material. This is an incredibly broad pool of organisms to draw from, and we are constantly being surprised by how many organisms are present in the microbiome which we have not yet characterized or generated a reference genome for.

In the end, if you are a researcher who uses WGS data to understand complex microbial communities, my only recommendation is that you approach reference-based metagenomic analysis with an appreciation of the biases that they bring along with their efficiency and speed. As a biologist who studies the microbiome I think that there is a lot more diversity out there than we have characterized in the lab, and I am always excited to find out what lies at the furthest reaches from the lamppost.

What's Big about Small Proteins?

Something interesting has been happening in the world of microbiome research, and it’s all about small proteins.

What’s New?

There was a paper in my weekly roundup of microbiome publications which caught my eye:

Petruschke, H., Schori, C., Canzler, S. et al. Discovery of novel community-relevant small proteins in a simplified human intestinal microbiome. Microbiome 9, 55 (2021).

Reading through the abstract, the authors have “a particular focus on the discovery of novel small proteins with less than 100 amino acids.” While this may seem to be a relatively innocuous statement, I was very interested to see what they found because of some recent innovations in the computational approaches used to study the microbiome.

What’s the Context?

When people study the microbiome, they often only have access to the genome sequences of the bacteria which are present. This is very much the case for the type of metagenomic analysis which I focus on, as with any approach which takes advantage of the massive amounts of data which can be generated with genome sequencing instruments.

When analyzing bacterial genomes, we are able to predict what genes are contained in each genome using annotation tools designed for this purpose. The most commonly used tool for this task is Prokka, made by Torsten Seemann. Recently, researchers have started to realize that there are some bacterial proteins which were being missed by these types of approaches, since the experimental data used to build the predictive models did not include a whole collection of small proteins.

Then, in 2019 Dr. Ami Bhatt’s group at Stanford published a high-profile paper making the case that microbiome analyses were systematically omitting small bacterial proteins:

Sberro H, Fremin BJ, Zlitni S, Edfors F, Greenfield N, Snyder MP, Pavlopoulos GA, Kyrpides NC, Bhatt AS. Large-Scale Analyses of Human Microbiomes Reveal Thousands of Small, Novel Genes. Cell. 2019 Aug 22;178(5):1245-1259.e14. doi: 10.1016/j.cell.2019.07.016. Epub 2019 Aug 8. PMID: 31402174; PMCID: PMC6764417.

Around the same time, other groups were publishing studies which used other experimental approaches which supported the idea that bacteria encoded these small genes, which were also being transcribed and translated as bona fide proteins (a few quick examples).

What’s the Point?

The reason I think this story is worth mentioning is because it shines light on part the foundation of microbiome research. When we conduct a microbiome experiment, we can only make a limited number of measurements. We then do the best job we can to infer the biological features which are relevant to our experimental question. Part of the revolution of microbiome research from the last ten years has been the explosion of metagenomic data which is now available. This research is particularly interesting because it shows us how our analysis of that data may have been missing an entire class of genetic elements — genes which encode proteins less than 100 amino acids in length.

At the end of the day, the message is a positive one: with improved experimental techniques we can now generate more useful and accurate data from existing datasets. I am looking forward to seeing what we are able to find as the field continues to explore this new area of the microbiome!

What's the Matter with Recombination?

Why would I be so bold as to assign required reading on a Saturday morning via Twitter? Because the ideas laid out in this paper have practical implications for many of the computational tools that we use to understand the microbiome. Taxonomy and phylogeny lies at the heart of k-mer based methods for metagenomics, as well as the core justification for measuring any marker gene (e.g. 16S) with amplicon sequencing.

Don’t get me wrong, I am a huge fan of both taxonomy and phylogeny as one of the best ways for humans to understand the microbial world, and I’m going to keep using both for the rest of my career. For that reason, I think it’s very important to understand the ways in which these methods can be confounded (i.e. the ways in which these methods can mislead us) by mechanisms like genomic recombination.

What Is Recombination?

Bacteria are amazingly complex creatures, and they do a lot more than just grow and divide. During the course of a bacterial cell’s life, it may end up doing something exciting like:

  • Importing a piece of naked DNA from its environment and just pasting it into its genome;

  • Using a small needle to inject a plasmid (small chromosome) into an adjacent cell; or

  • Package up a small piece of its genome into a phage (protein capsule) which contains all of the machinery needed to travel a distance and then inject that DNA into another bacterium far away.

Not all bacteria do all of these things all of the time, but we know that they do happen. One common feature of these activities is that genetic material is exchanged between cells in a manner other than clonal reproduction (when a single cell splits into two). In other words, these are all forms of ‘recombination.’

How Do We Study the Microbiome?

Speaking for myself, I study the microbiome by analyzing data generated by genome sequencing instruments. We use those instruments to identify a small fraction of the genetic sequences contained in a microbiome sample, and then we draw inferences from those sequences. This may entail amplicon sequencing of the 16S gene, bulk WGS sequencing of a mixed population, or even single-cell sequencing of individual bacterial cells. Across all of these different technological approaches, we are collecting a small sample of the genomic sequences present in a much larger microbiome sample, and we are using that data to gain some understanding of the microbiome as a whole. In order to extrapolate from data to models, we rely on some key assumptions of how the world works, one of which being that bacteria do not frequently recombine.

What Does Recombination Mean to Me?

If you’ve read this far you are either a microbiome researcher or someone very interested in the topic, and so you should care about recombination. As an example, let’s walk through the logical progression of microbiome data analysis:

  • I have observed microbial genomic sequence S in specimen X. This may be an OTU, ASV, or WGS k-mer.

  • The same sequence S can also be observed in specimen Y, but not specimen Z. There may be some nuances of sequencing depth and the limit-of-detection, but I have satisfied myself that for this experiment marker S can be found in X and Y, but not Z.

  • Because bacteria infrequently recombine, I can infer that marker S represents a larger genomic region G which is similarly present in X and Y, but not Z. For 16S that genomic region would be the species- or genus-level core genome, and for WGS it could also be some accessory genetic elements like plasmids, etc. In the simplest rendering, we may give a name to genomic region G which corresponds to the taxonomic label for those organisms which share marker S (e.g. Escherichia coli).

  • When I compare a larger set of samples, I find that the marker S can be consistently found in samples obtained from individuals with disease D (like X and Y) but not in samples from healthy controls (like Z). Therefore I would propose the biological model that organisms containing the larger genomic region G are present at significantly higher relative abundance in the microbiome of individuals with disease D.

In this simplistic rendering I’ve tried to make it clear that the degree to which bacteria recombine will have a practical impact on how much confidence we can have in inferences which rely on the concepts of taxonomy or phylogeny.

The key idea here is that if you observe any marker S, we tend to assume that there is a monophyletic group of organisms which share that marker sequence. Monophyly is one of the most important concepts in microbiome analysis which also happens to be a lot of fun to say — it’s worth reading up on it.

How Much Recombination Is There?

Getting back to the paper that started it all, the authors did a nice job of carefully estimating the frequency of recombination across a handful of bacterial species for which a reasonable amount of data is available. The answer they found is that recombination rates vary, and this answer matches our mechanistic understanding of recombination. The documented mechanisms of recombination vary widely across different organisms, and there is undoubtedly a lot more out there we haven’t characterized yet.

At the end of the day, we have only studied a small fraction of the organisms which are found in the microbiome. As such, we should approach them with a healthy dose of skepticism for any key assumption, like a lack of recombination, which we know is not universal.

In conclusion, I am going to continue to use taxonomy and phylogeny every single day that I study the microbiome, but I’m also going to stay alert for how recombination may be misleading me. On a practical note, I am also going to try to use methods like gene-level analysis which keep a tight constraint on the size of regions G which are inferred from any marker S.